Data Analysis with R Programming
RStudio Cloud (now called Posit Cloud) is the primary tool
- Install packages to RStudio Cloud: The lubridate package is part of the tidyverse. The tidyverse is a collection of packages in R with a common design philosophy for data manipulation, exploration, and visualization. For a lot of data analysts, the tidyverse is an essential tool.Quick list of useful R packages, CRAN Task Views
To install the core tidyverse packages and load them, follow these steps:- In the bottom of the console, type install.packages(“tidyverse”) and press Enter (Windows), tidyverse_update() when you want to update
- Load the tidyverse library with the library() function. To load the core tidyverse, type library(tidyverse) and press Enter (Windows)
- Load the lubridate package. Since this is already part of the tidyverse package, there is no need to re-install. However, the library will need to be loaded. Type library(lubridate) into the console pane and press Enter (Windows) Read tidyverse vignettes eg browseVignettes(“ggplot2”)
- Data structure
The most common data structures in the R programming language include:- Vectors: There are two types of vectors: atomic vectors and lists Atomic vectors can only contain elements of the same type. If you want to store elements of different types in the same data structure, you can use a list.\
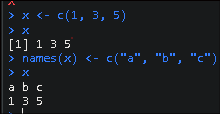
Type Description Example Logical True/False TRUE Integer Positive and negative whole values 3 Double Decimal values 101.175 Character String/character values “Coding” - The c() function in R combines multiple values into a vector
- You can determine what type of vector you are working with by using the typeof() function
- You can determine the length of an existing vector–meaning the number of elements it contains–by using the length() function
- You can also check if a vector is a specific type by using an is function: is.logical(), is.double(), is.integer(), is.character(). R returns bool value
- You can use the names() function to assign a different name to each element of the vector.
- Creating lists
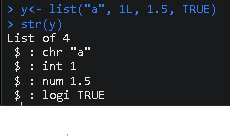
- You can create a list with the list() function. eg list(“a”, 1L, 1.5, TRUE)
- you can even store a list inside a list inside a list—and so on
- If you want to find out what types of elements a list contains, you can use the str() function
- You can name the elements of a list when you first create it with the list() function: eg: list(‘Chicago’ = 1, ‘New York’ = 2, ‘Los Angeles’ = 3) $
Chicago
- Dates and times in R We work with dates and times in R using the lubridate package.
- you can use the install.packages() function by install.packages(“tidyverse”)
- Next, load the tidyverse and lubridate packages using the library() function eg:> library(tidyverse) > library(lubridate) Working with dates and times Types
- In R, there are three types of data that refer to an instant in time:
- A date (“2016-08-16”)
- A time within a day (“20:11:59 UTC”)
- And a date-time. This is a date plus a time (“2018-03-31 18:15:48 UTC”)
To get the current date you can run the today() function. The date appears as year, month, and day. today() #> [1] “2021-01-20”
To get the current date-time you can run the now() function.
When working with R, there are three ways you are likely to create date-time formats: \ - From a string
First, identify the order in which the year, month, and day appear in your dates. Then, arrange the letters y, m, and d in the same order. That gives you the name of the lubridate function that will parse your date. For example, for the date 2021-01-20, you use the order ymd:
ymd(“2021-01-20”) or mdy(“January 20th, 2021”) #> [1] “2021-01-20” - From an individual date
The ymd() function and its variations create dates. To create a date-time from a date, add an underscore and one or more of the letters h, m, and s (hours, minutes, seconds) to the name of the function: ymd_hms(“2021-01-20 20:11:59”) #> [1] “2021-01-20 20:11:59 UTC” - From an existing date/time object
You can use the function as_date() to convert a date-time to a date. For example, put the current date-time—now()—in the parentheses of the function. as_date(now()) #> [1] “2021-01-20” - R creates dates in the standard yyyy-mm-dd format by default.
facet_wrap() is an R function used to create subplots, which are individual plots that represent a specific part of a broader dataset.
- Data frames
A data frame is a collection of columns–similar to a spreadsheet or SQL table. Each column has a name at the top that represents a variable, and includes one observation per row. Data frames help summarize data and organize it into a format that is easy to read and use.
when you are working with data frames:- First, columns should be named.
- Second, data frames can include many different types of data, like numeric, logical, or character.
- Finally, elements in the same column should be of the same type. syntax: data.frame(x = c(1, 2, 3) , y = c(1.5, 5.5, 7.5))
- Files
- Use dir.create (“destination_folder”) function to create a new folder, or directory, to hold your files.
- file.create (“new_text_file.txt/new_word_file.docx/new_csv_file.csv”) to create a blank file
- If the file is successfully created when you run the function, R will return a value of TRUE
- Copying a file can be done using the file.copy (“new_text_file.txt” , “destination_folder”)
- You can delete R files using the unlink (“some_.file.csv”)
- Matrices
A matrix is a two-dimensional collection of data elements. This means it has both rows and columns.But like vectors, matrices can only contain a single data type. For example, you can’t have both logicals and numerics in a matrix.
you want to create a 2x3 (two rows by three columns) matrix containing the values 3-8. First, enter a vector containing that series of numbers: c(3:8). Then, enter a comma. Finally, enter nrow = 2 to specify the number of rows.
matrix(c(3:8), nrow = 2) - Logical operators
- AND (sometimes represented as & or && in R)
- OR (sometimes represented as | or || in R)
- NOT (!)
- Conditional statements
- if(){}
- else(){}
- else if(){}
- Four packages that are an essential part of the workflow for data analysts:
- ggplot2 : Create a variety of data viz by applying different visual properties to the data variables in R
- dplyr : Offers a consistent set of functions that help you complete some common data manipulation tasks
- tidyr : A package used for data cleaning to make tidy data
- readr : Used for importing data Data frames Matrices Arrays
Enjoy Reading This Article?
Here are some more articles you might like to read next: